David Baker, BArch(Hons), PGCE, MPhil (Education Research) is a 2nd year PhD student at the Faculty of Education, University of Cambridge. David describes himself as a complexity-sensitive, qualitative-focussed mixed methods researcher. He is currently carrying out a pilot study at a school in London to test out his methodologies and methods in preparation for a major study of the staff welfare provision in Cambridgeshire secondary schools.
My research area, my research question, and the need to understand wellbeing
I am an ex-architect and ex-teacher, so it perhaps won’t surprise you to learn that my research addresses the design of schools. Within that broad area I have chosen to focus on the needs of the adults who work in schools. My PhD research project seeks to understand the impact that staff welfare facilities (such as staffrooms, changing rooms, showers and such like) have on the wellbeing of the staff. My theory is that providing good facilities makes the staff happier, and that in turn makes pupils happier. And that then raises pupil attainment as well as helping with recruitment and retention of staff. It is all connected, but in complex ways.
Each member of staff experiences life at school in a different and individual way. In order to understand that experience, so that perhaps I can design something that make their lives better, I need to find out how they are feeling. Are they happy at work? Could their quality of life be improved? To answer those questions, I needed to get a clear picture of their wellbeing, both as individuals and as a group.
Choosing a way of understanding; choosing WEMWBS; licences, versions, and online survey
There are a great many ways of capturing a picture of someone’s wellbeing. Cooke et al. (2016) identified some 42 ‘instruments’ for measuring wellbeing. They range from the very simple, looking at only 3 aspects of quality of life, to extreme sophistication looking at 135 aspects of mental health. The Warwick-Edinburgh Mental Wellbeing Scales (WEMWBS) sits at the lower end of the range, having 14 questions. Nevertheless, it seemed to me to cover a sensible range of feelings from optimism and energy levels to thinking clearly and confidence. It was also well supported on its website. In addition it has been used successfully to measure teacher wellbeing by a number of research groups (see for example, Kidger et al. 2016) and is the instrument used each year by Education Support in their annual Teacher Wellbeing Index reports.
WEMWBS is protected by copyright and so you will need to fill out a short questionnaire and then email them to register yourself as a non-commercial user. They responded very quickly with the permission. WEMWBS is available in two versions (and in 36 languages), namely a 7 item and a 14 item version. I chose the 14 item version as I felt it captures a wider range of feelings and experiences. It does however produce, clearly, twice as much data to analyse, but that seemed manageable given my scale of operation.
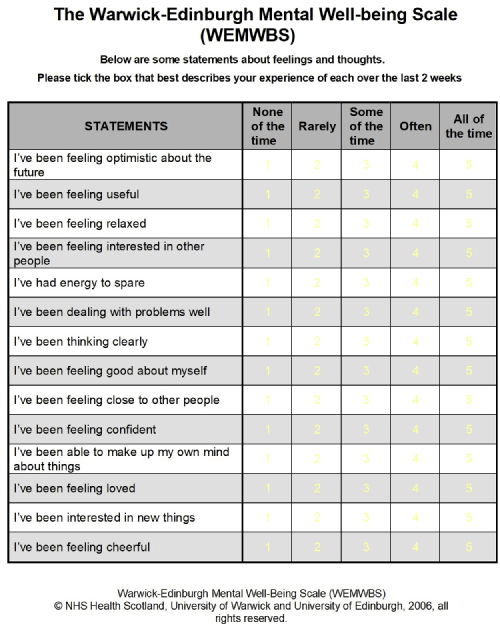
I used the excellent Qualtrics system to design and manage an eighteen question online survey of the staff at my pilot study school. I incorporated the 14 WEMWES statements using a matrix table format and the Likert scale categories of ‘none of the time/rarely/some of the time/often/all the time’.
The results of the survey and their presentation
I ran the survey for two weeks and received 98 completed responses from the 250 staff at the school. Talking about their wellbeing appeared to be something that many staff were happy to do. I then used the Reports facility in Qualtrics to visualise the data and to carry out a number of fairly basic comparisons between the answers to different survey questions.
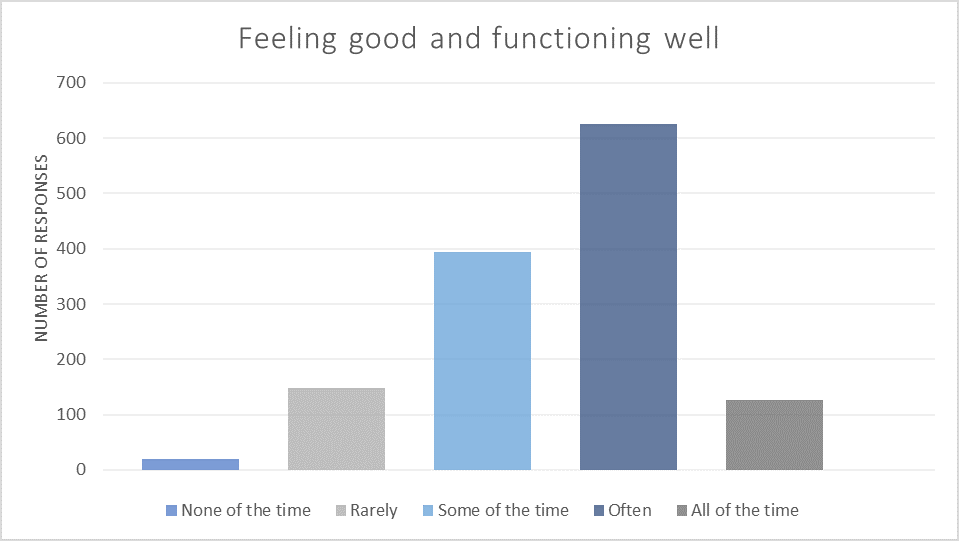
One of the report formats totalled up the WEMWBS entries for each category on the Likert scales, but there was no facility in Qualtrics for visualising these data.I thus exported the data into Excel and produced a chart illustrating the total responses in each Likert category – a kind of wellbeing profile for this particular school. The chart title – feeling good and functioning well – is the WEMWBS short definition of wellbeing.
One of the strengths of WEMWBS is that it allows you to assign a score to each response. ‘None of the time’ scores 1; ‘all of the time’ scores 5. When totalled up, these scores indicate the level of an individual’s wellbeing. Thus, a score of 40 or less indicates probable depression, 41-44 indicates possible depression, 45-59 represents average mental wellbeing and scores of 60 or more shows high mental wellbeing.
However, whilst the Qualtrics allowed me to look at the totals of responses in each Likert category, it did not give numeric scores to individual respondents, and this seemed important in identifying the lived experiences of the individuals. Laboriously I scored each response, first on paper and then entered and totalled up in Excel. If anyone knows of a computerised way of doing this, I’d love to hear it. This allowed me to see the range of individuals’ wellbeing scores in the school.
Again, using Excel, I was able to visualise the spread of mental wellbeing scores across the 98 respondents.

So what?
Using the WEMWBS rubric, one can immediately see that 10 members of staff are probably depressed and 12 are possibly depressed, whilst 59 are experiencing average mental wellbeing and 5 high mental wellbeing. Using this information, senior leaders at the school could thus target support to those who appear to be most unwell.
But there is a conundrum with the WEMWES approach. On the one hand one hears voices telling us to ‘ … abandon the urge to simplify everything, to look for formulas and easy answers ….’ (Peck, 1998, p.14) and that ‘all too often, our responses involve attempts to reduce, control, or simply ignore the effects of complexity’ (Poth, 2018, p.8). On the other hand, as an architect, one has to commit to simple structures – walls, floors, roofs – to shelter the complexity of life.
Perhaps the ultimate justification for using WEMWBS is to be found in Smith, Flowers and Larkin (2009, p.183) quoting Yardley (2000) ‘…. However well a piece of research is conducted, a test of its real validity lies in whether it tells the reader something interesting, important or useful’. I think that WEMWBS does those three things.
References
Cooke, P. J., Melchert, T. P., & Connor, K. (2016). Measuring Well-Being: A Review of Instruments. The Counselling Psychologist, 44(5), 730–757. https://doi.org/10.1177/0011000016633507
Kidger, J., Brockman, R., Tilling, K., Campbell, R., Ford, T., Araya, R., King, M., & Gunnell, D. (2016). Teachers’ wellbeing and depressive symptoms, and associated risk factors: A large cross sectional study in English secondary schools. Journal of Affective Disorders, 192, 76–82. https://doi.org/10.1016/j.jad.2015.11.054
Peck, M. S. (1998). The Road Less Travelled: A New Psychology of Love, Traditional Values and Spiritual Growth (2nd edition). Touchstone.
Poth, C. N. (2018). Innovation in mixed methods research: A practical guide to integrative thinking with complexity. SAGE.
Smith, J., Larkin, M., & Flowers, P. (2009). Interpretative phenomenological analysis: Theory, method and research. SAGE.

There’s a lot that’s positive about the WEMWBS tools. Not least the scale at which it’s been used, allowing us access to a national sample (n30,000) as a baseline with which to compare results. Also of note is it’s positive framing of questions alluding to hedonic and eudemonic elements, vital to wellbeing. Here at Noise Solution we’re using SWEMWBS (the shortened version for our wellbeing metrics. We’ve also built into a cloud-based platform the ability to capture and automatically analyse (looking for statistical significance, using Wilcoxon rank test and range of change (of) wellbeing using Cohen’s scale, while visualising changes in wellbeing by demographic. You can see what that looks like here https://sforce.co/3qZffgQ
LikeLike
Nice blog David, as this tool is widely used, and good to see a concrete example. What do you think are the ethical implications of researchers using such tools when you are flagging up issues about colleagues mental health? By the way, you should be able to export data from Qualtrics to SPSS to help you create graphical displays.
LikeLike